
Religious Identity of Jewish Adults
Cite this page
Israel NOWlej (2027), DEM-007, p. 76, israelnowlej.com/dem-007
Short address: israelnowlej.com/dem-007
Text of this page
INFOGRAPHICS
DEMOGRAPHICS Religious Identity of Jewish Adults
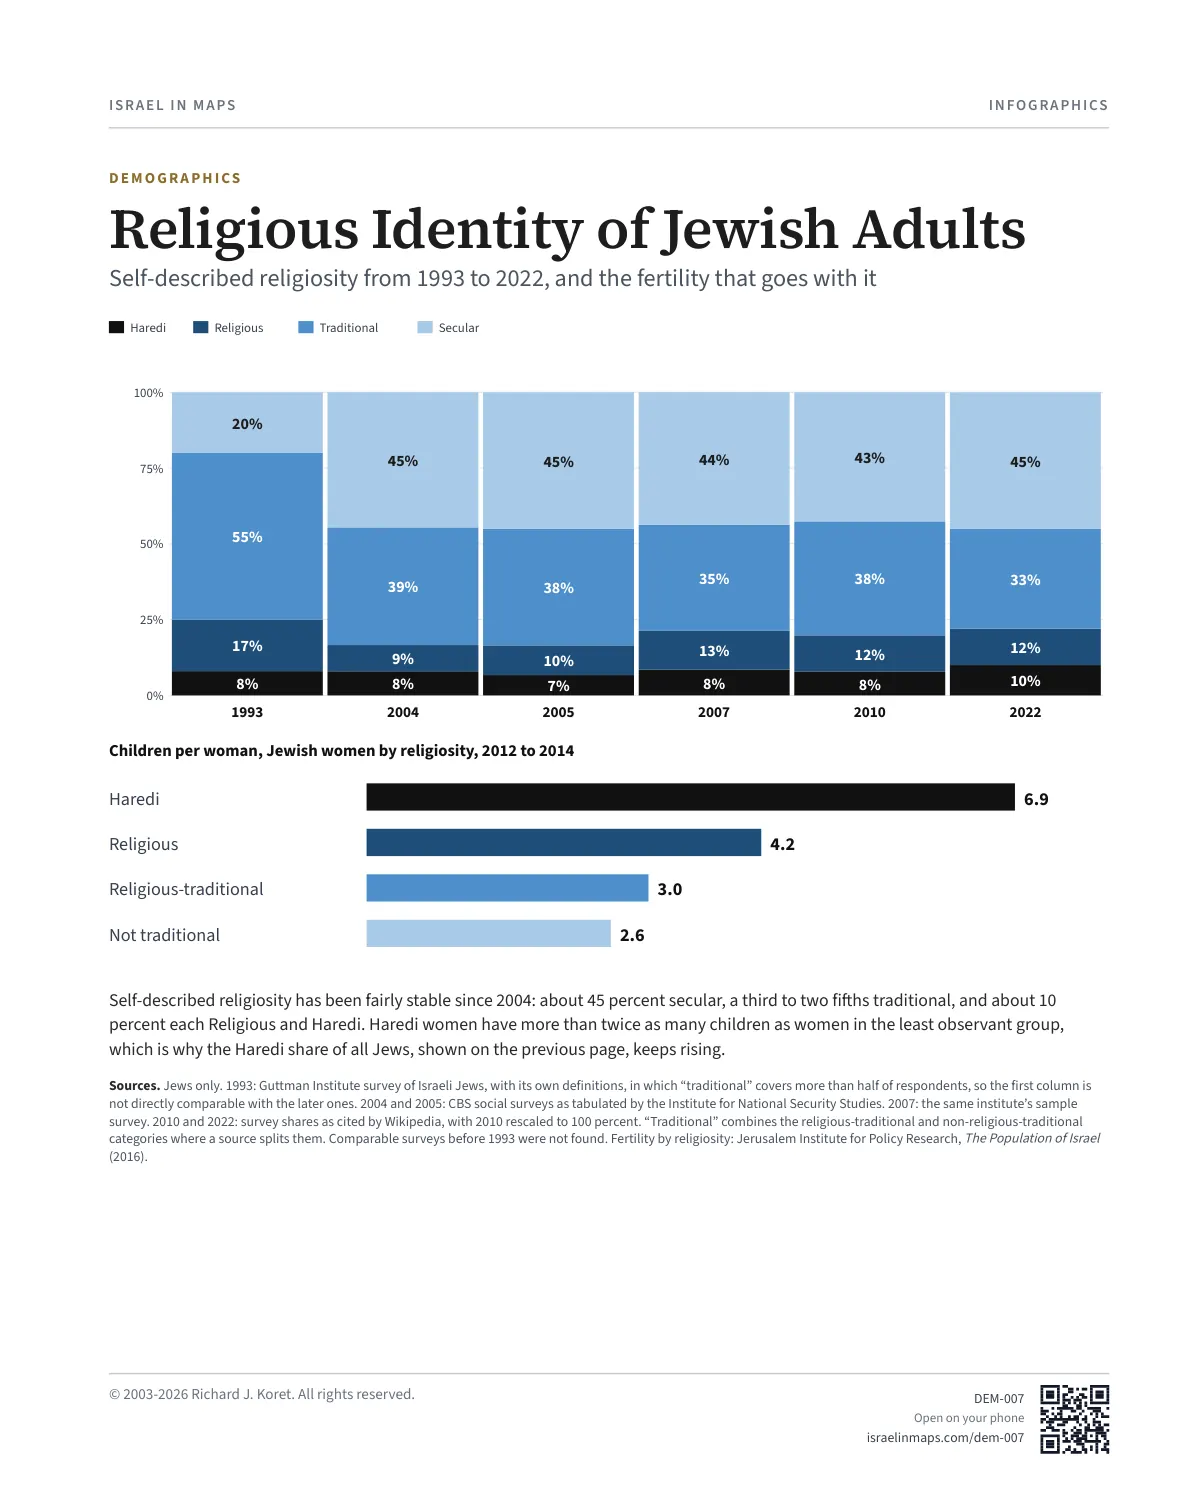
Self-described religiosity from 1993 to 2022, and the fertility that goes with it
Haredi Religious Traditional Secular
0%
25%
50%
75%
100%
8%
17%
55%
20%
8%
9%
39%
45%
7%
10%
38%
45%
8%
13%
35%
44%
8%
12%
38%
43%
10%
12%
33%
45%
Children per woman, Jewish women by religiosity, 2012 to 2014
Haredi 6.9
Religious 4.2
Religious-traditional 3.0
Not traditional 2.6
Self-described religiosity has been fairly stable since 2004: about 45 percent secular, a third to two fifths traditional, and about 10 percent each Religious and Haredi. Haredi women have more than twice as many children as women in the least observant group, which is why the Haredi share of all Jews, shown on the previous page, keeps rising.
Sources. Jews only. 1993: Guttman Institute survey of Israeli Jews, with its own definitions, in which “traditional” covers more than half of respondents, so the first column is not directly comparable with the later ones. 2004 and 2005: CBS social surveys as tabulated by the Institute for National Security Studies. 2007: the same institute’s sample survey. 2010 and 2022: survey shares as cited by Wikipedia, with 2010 rescaled to 100 percent. “Traditional” combines the religious-traditional and non-religious-traditional categories where a source splits them. Comparable surveys before 1993 were not found. Fertility by religiosity: Jerusalem Institute for Policy Research, The Population of Israel (2016).
DEM007 Open on your phone $.- ’)*2’ % *(„ (›
Corrections: none recorded. This is the current version. The 2027 print edition copy is at israelnowlej.com/2027/dem-007.