
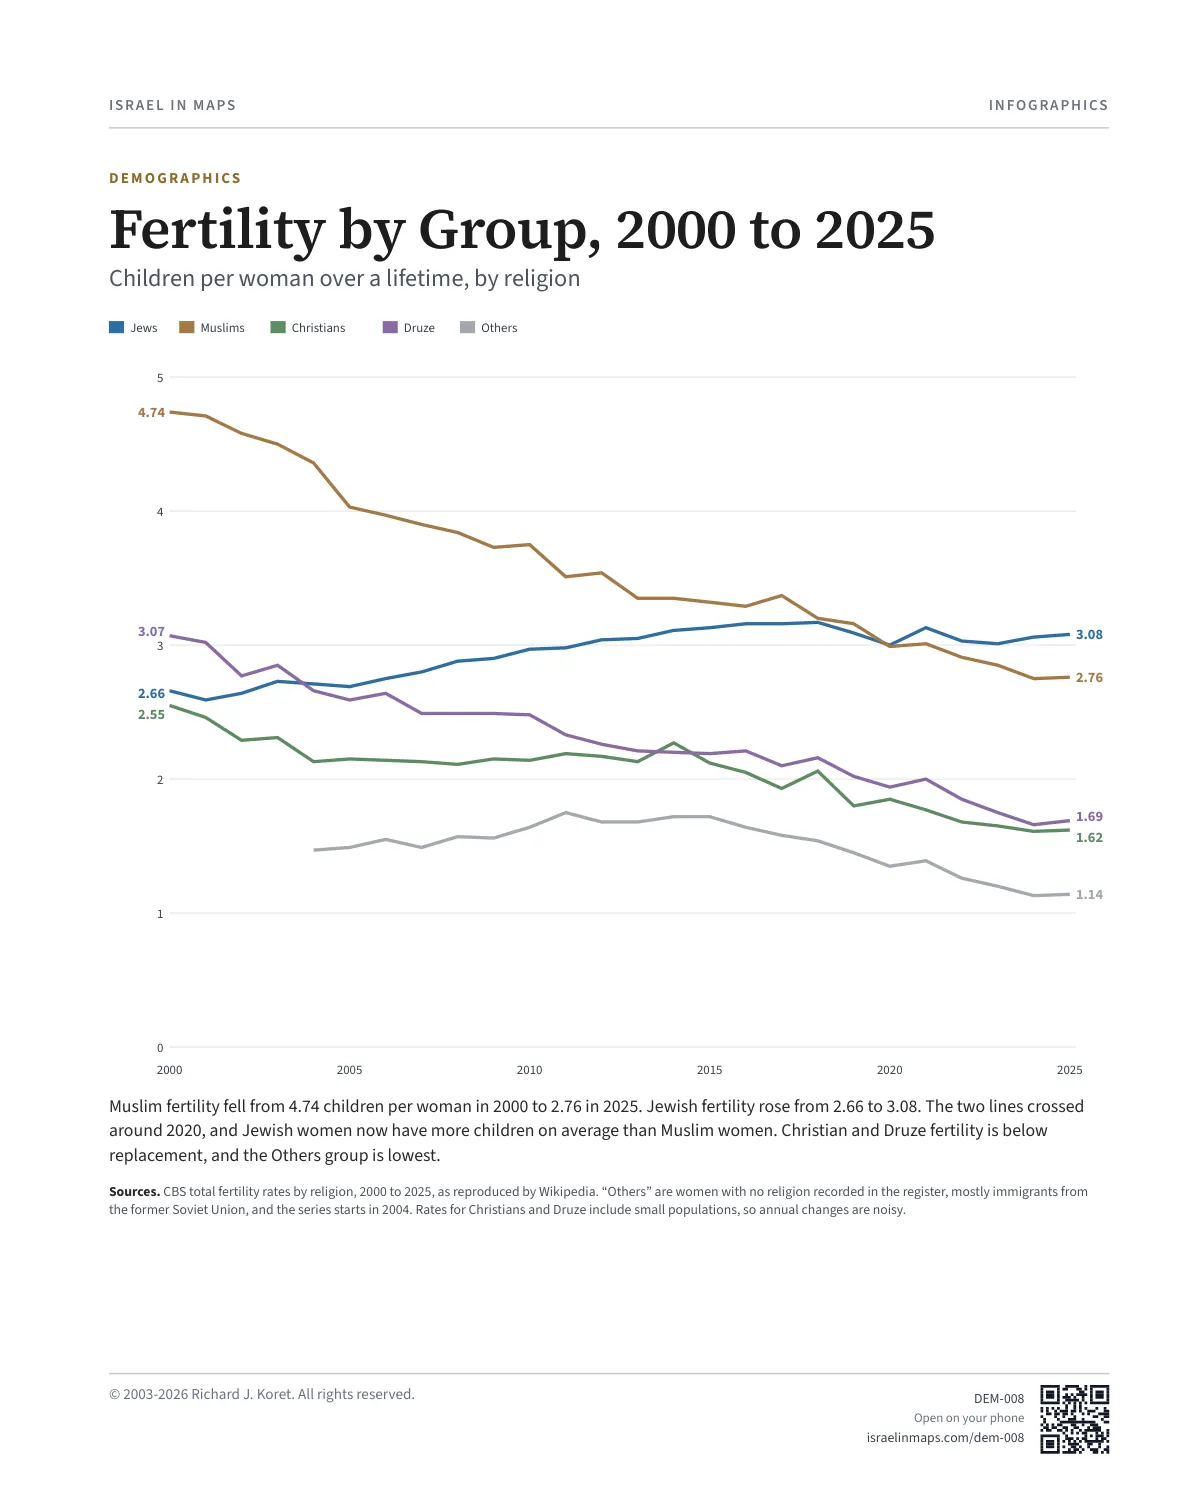
Fertility by Group, 2000 to 2025
Cite this page
Israel NOWlej (2027), DEM-008, p. 77, israelnowlej.com/dem-008
Short address: israelnowlej.com/dem-008
Text of this page
INFOGRAPHICS
DEMOGRAPHICS Fertility by Group, 2000 to 2025
Children per woman over a lifetime, by religion
Jews Muslims Christians Druze Others
3.08
2.66 2.76
4.74
1.62
2.55
1.69
3.07
1.14
Muslim fertility fell from 4.74 children per woman in 2000 to 2.76 in 2025. Jewish fertility rose from 2.66 to 3.08. The two lines crossed around 2020, and Jewish women now have more children on average than Muslim women. Christian and Druze fertility is below replacement, and the Others group is lowest.
Sources. CBS total fertility rates by religion, 2000 to 2025, as reproduced by Wikipedia. “Others” are women with no religion recorded in the register, mostly immigrants from the former Soviet Union, and the series starts in 2004. Rates for Christians and Druze include small populations, so annual changes are noisy.
DEM008 Open on your phone $.- ’)*2’ % *(„ (›
Corrections: none recorded. This is the current version. The 2027 print edition copy is at israelnowlej.com/2027/dem-008.