
Immigration to Israel, 1948 to 2025
Cite this page
Israel NOWlej (2027), DEM-005, p. 74, israelnowlej.com/dem-005
Short address: israelnowlej.com/dem-005
Text of this page
INFOGRAPHICS
DEMOGRAPHICS Immigration to Israel, 1948 to 2025
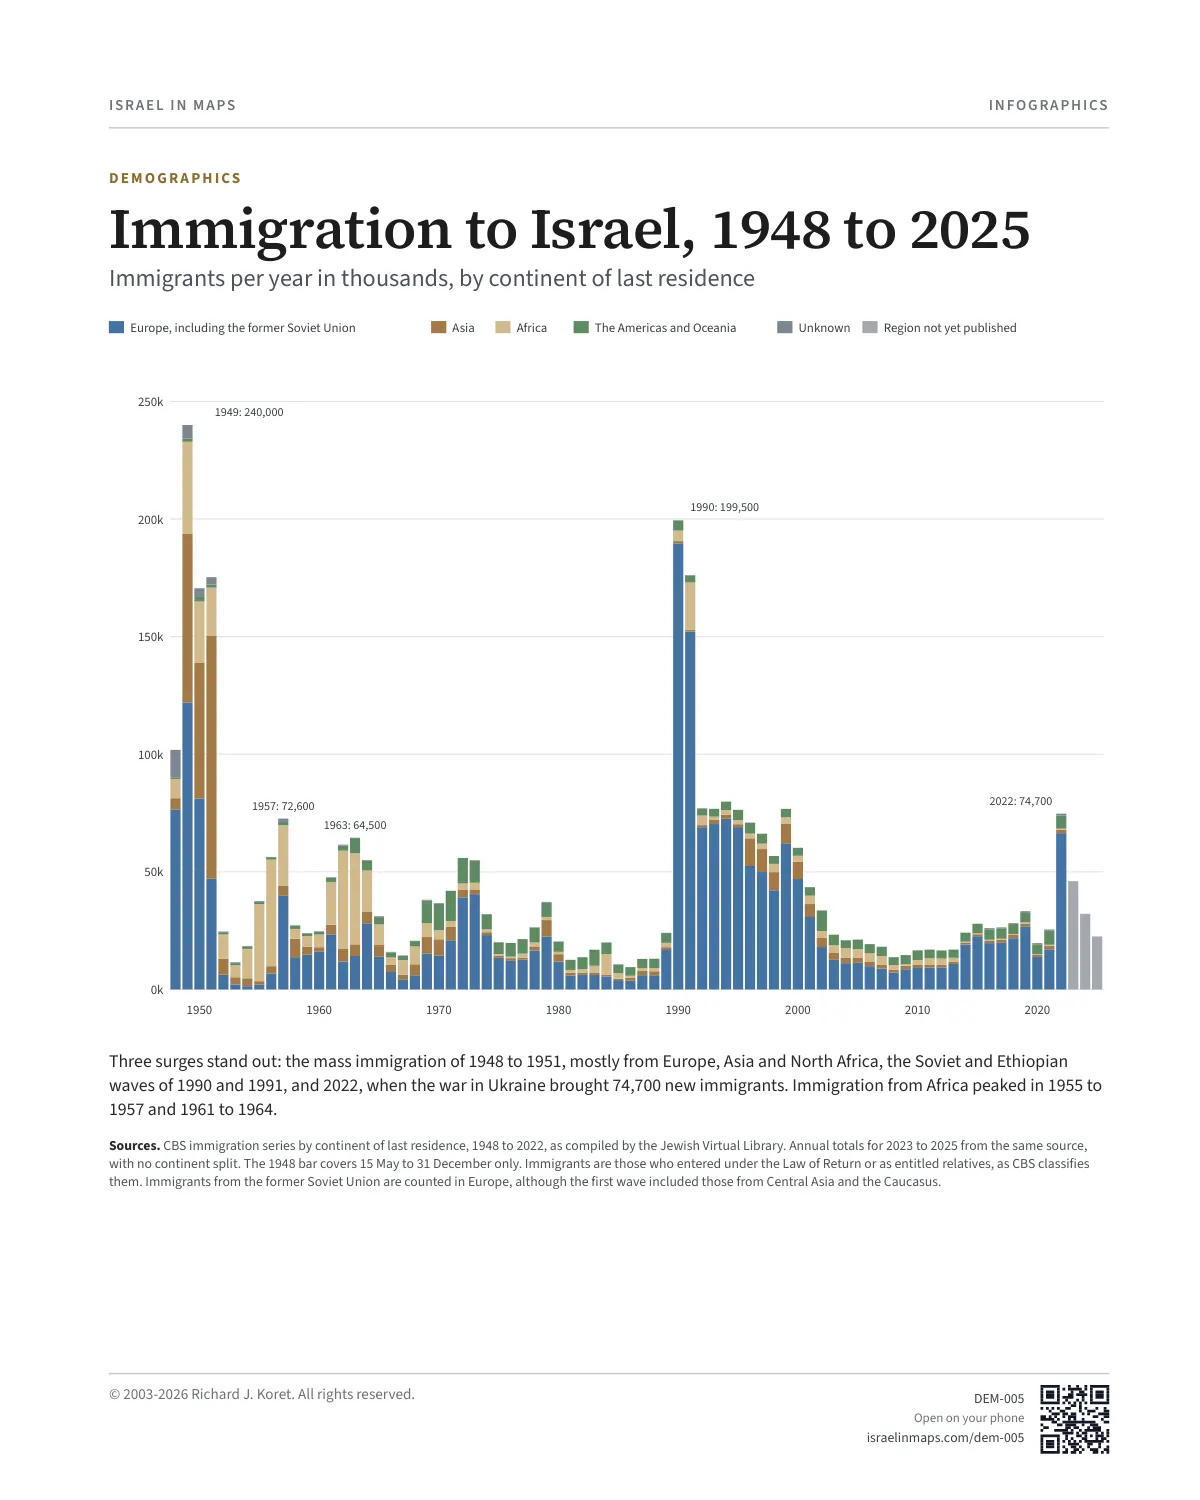
Immigrants per year in thousands, by continent of last residence
Europe, including the former Soviet Union Asia Africa The Americas and Oceania Unknown Region not yet published
0k
50k
100k
150k
200k
250k
1949: 240,000
1990: 199,500
2022: 74,700 1957: 72,600
1963: 64,500
Three surges stand out: the mass immigration of 1948 to 1951, mostly from Europe, Asia and North Africa, the Soviet and Ethiopian waves of 1990 and 1991, and 2022, when the war in Ukraine brought 74,700 new immigrants. Immigration from Africa peaked in 1955 to 1957 and 1961 to 1964.
Sources. CBS immigration series by continent of last residence, 1948 to 2022, as compiled by the Jewish Virtual Library. Annual totals for 2023 to 2025 from the same source, with no continent split. The 1948 bar covers 15 May to 31 December only. Immigrants are those who entered under the Law of Return or as entitled relatives, as CBS classifies them. Immigrants from the former Soviet Union are counted in Europe, although the first wave included those from Central Asia and the Caucasus.
DEM005 Open on your phone $.- ’)*2’ % *(„ (›
Corrections: none recorded. This is the current version. The 2027 print edition copy is at israelnowlej.com/2027/dem-005.