
Age Structure
Cite this page
Israel NOWlej (2027), DEM-009, p. 78, israelnowlej.com/dem-009
Short address: israelnowlej.com/dem-009
Text of this page
INFOGRAPHICS
DEMOGRAPHICS Age Structure
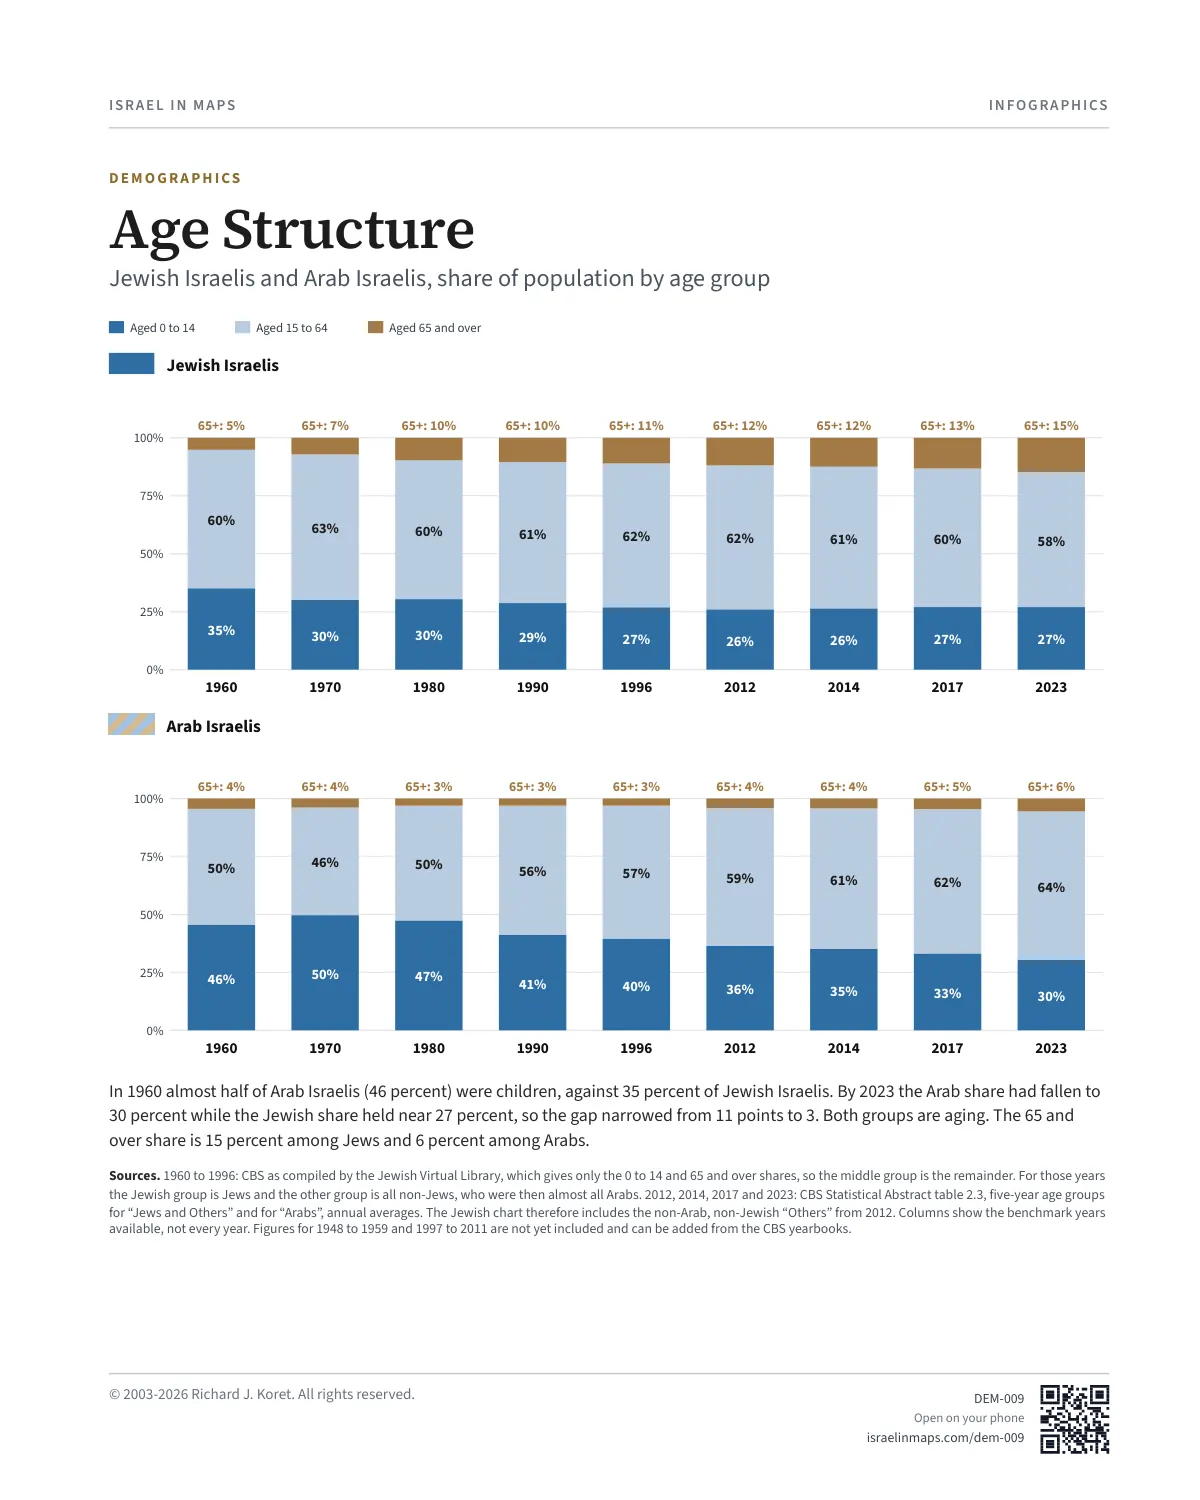
Jewish Israelis and Arab Israelis, share of population by age group
Aged 0 to 14 Aged 15 to 64 Aged 65 and over
Jewish Israelis
0%
25%
50%
75%
100%
35%
60%
65+: 5%
30%
63%
65+: 7%
30%
60%
65+: 10%
29%
61%
65+: 10%
27%
62%
65+: 11%
26%
62%
65+: 12%
26%
61%
65+: 12%
27%
60%
65+: 13%
27%
58%
65+: 15%
Arab Israelis
0%
25%
50%
75%
100%
46%
50%
65+: 4%
50%
46%
65+: 4%
47%
50%
65+: 3%
41%
56%
65+: 3%
40%
57%
65+: 3%
36%
59%
65+: 4%
35%
61%
65+: 4%
33%
62%
65+: 5%
30%
64%
65+: 6%
In 1960 almost half of Arab Israelis (46 percent) were children, against 35 percent of Jewish Israelis. By 2023 the Arab share had fallen to 30 percent while the Jewish share held near 27 percent, so the gap narrowed from 11 points to 3. Both groups are aging. The 65 and over share is 15 percent among Jews and 6 percent among Arabs.
Sources. 1960 to 1996: CBS as compiled by the Jewish Virtual Library, which gives only the 0 to 14 and 65 and over shares, so the middle group is the remainder. For those years the Jewish group is Jews and the other group is all non-Jews, who were then almost all Arabs. 2012, 2014, 2017 and 2023: CBS Statistical Abstract table 2.3, five-year age groups for “Jews and Others” and for “Arabs”, annual averages. The Jewish chart therefore includes the non-Arab, non-Jewish “Others” from 2012. Columns show the benchmark years available, not every year. Figures for 1948 to 1959 and 1997 to 2011 are not yet included and can be added from the CBS yearbooks.
DEM009 Open on your phone $.- ’)*2’ % *(„ (›
Corrections: none recorded. This is the current version. The 2027 print edition copy is at israelnowlej.com/2027/dem-009.